Saturday, 17 December 2011

Put Intelligence on the map (part 2)

In my last post, we discussed how OBIEE enables geospatial analysis on digital map. Now it’s time to get hands dirty and learn more from practice.

Out of the box, the deployment of OBIEE includes Oracle Mapviewer. However, no geospatial data or map tiles are provided with the product installation. Those can be acquired separately from NAVTEQ. A package of free sample NAVTEQ data with relevant deployment instructions can be downloaded from the URL: http://www.oracle.com/technetwork/middleware/bi-foundation/obiee-samples-167534.html

The free sample NAVTEQ data contains two components: geospatial data (coordinates, boundaries, etc) and map tiles (background images for different zoom level) which are good enough for you to have a preliminary taste of OBIEE geospatial analysis. But, if you want to analyze your business intelligence on street- level detail map or with specific postcode/suburb boundary in your country, you need to find more comprehensive source for map tiles and geospatial data. For something that you want to put on production, paid data package with professional support services should always be the first choice. For learning, practicing or demoing purpose, there is free self-service approach to achieve your goal. In this blog post, you will see how to leverage government’s statistic websites and Google map to have you business intelligence on local map with local boundaries. Instead of having lame geospatial analysis like this:
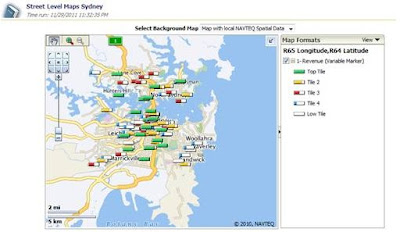

You will be able to achieve a much better one like this:


Step 1, Download Boundary Geospatial data

In order to draw boundary on the map, we need geospatial data stored in oracle database (with Spatial or Locator option, of course). The Sample NAVTEQ data doesn’t contain detail boundary information for countries other than United States. We need to find it from somewhere else.

 As I live in Australia, I will use Australia New South Wales Electoral boundary data as example here. The two government websites below provide very rich geospatial data for different categories. Make sure the data you choose is ESRI ShapeFile format and has “boundary” information, as we want to generate thematic view on our BI Map report. You should be able to find similar free information from your local government websites.
http://data.gov.au/tag/geospatial-information/
http://www.aec.gov.au/Electorates/gis/gis_datadownload.htm

After the extraction of download zip file, you should have a set of files look similar to:
ESRI Shape Files

 Step 2, Import ShapeFile data into your Oracle database 

1, Make sure the availability of the following files in the file system of your Oracle database server:
$ORACLE_HOME/jdbc/lib/ojdbc5.jar
$ORACLE_HOME/md/jlib/sdoutl.jar
$ORACLE_HOME/md/jlib/sdoapi.jar

If you are missing Sdoutl.jar and sdoapi.jar, they can be downloaded from http://www.oracle.com/technetwork/database/options/spatial/downloads/software/sp-download-distlic-522138.html

2, Copy the Shapefiles to the file system of your database server;


3, Run Oracle MapBuilder to import ShapeFile into Oracle database;

Connect to your database at first


Choose the shapefile that you downloaded;

Keep the default value and click on “next”;


Choose NOT to create theme now and go next

Then you should be able to find a new table created in your database:


Step 3, Create Geometry Theme in Oracle database for the boundary data imported


1, right click on “Geometry Themes” and create a new theme;
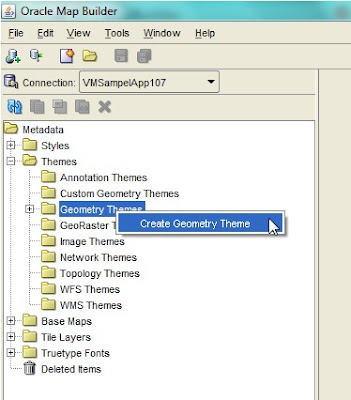


3, in the wizard, make sure you choose the imported geospatial table for “Base Table”;
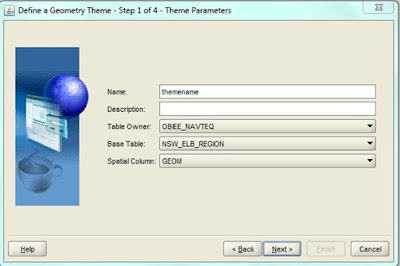


4, Tick the box label style and choose a column as attribute for this style. Later on you will use this column to link with the geo information column (e.g. city name, district name, etc) in your BI subject area. Specify the value for “Label Style” and change the value for “Label Function” from -1 to 1. In this example, I used the column “Electoral Division name”;


5, specify the query condition if you have any


6,  Click on Finish to create the theme;


Step 4, Setup Google Map in Oracle MapViewer
Because the NavTeq sample data doesn’t provide map background details beyond country level for Countries other than United States, we want to leverage Google Map as a service for the background images. The instructions for configuring Google Map with Oracle Mapviewer can be found from the section 2.7.2 of deployment guide for OBIEE Sample App.

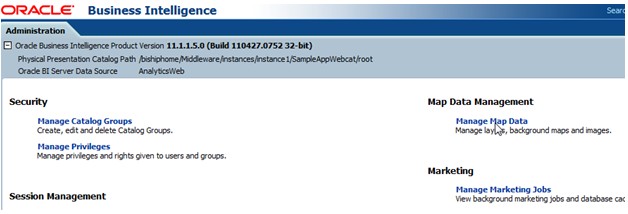
5, Setup layers and background map in OBIEE 1, click on manage map data in OBIEE administration page


2, Import a new layer. Choose to import layers from the Geometry Theme that you just created in step 3.3;

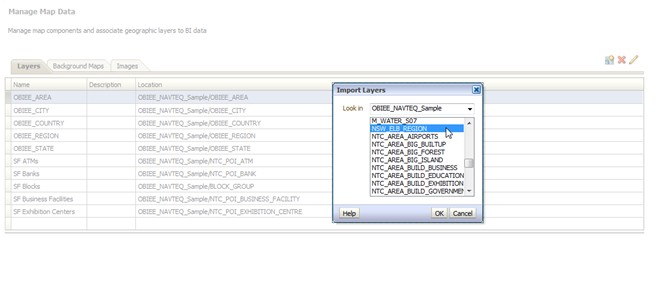
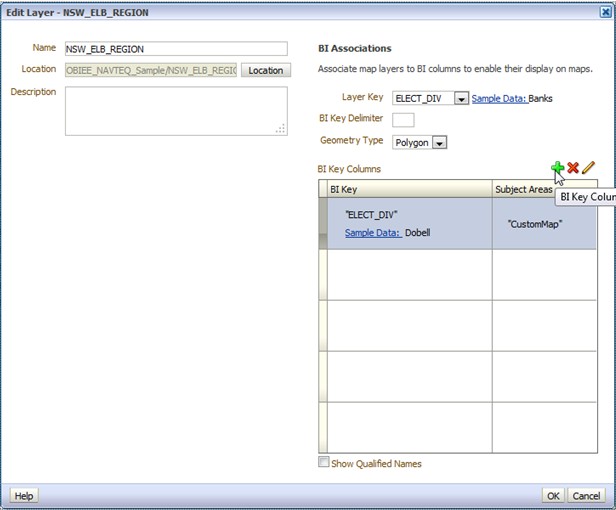
3, Click on the pencil icon to edit the newly created layer. Map the Layer Key with a BI Key from your BI subject area. Normally the BI Key will be a dimensional table column for end user facing geospatial information such as country name, city name, district name, etc. Click on OK to save the changes;

4, Go to “Background Maps” tab and click on “import background maps”. Chose the Google Map entry that you configured in step 4;


5, Add an interactive BI Layer to the background map. Choose the one that you just imported at step 5.3
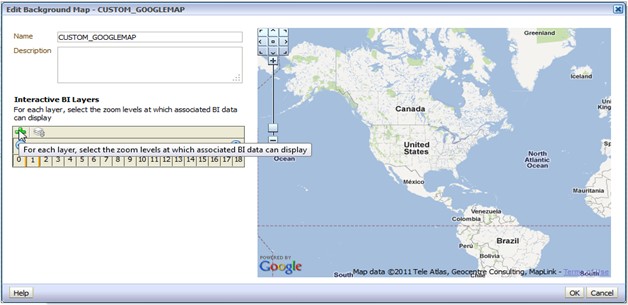
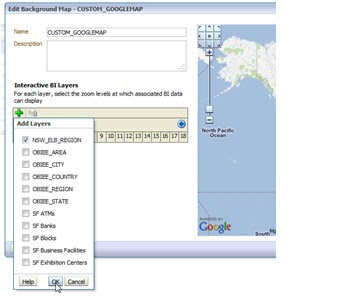
6, setup a proper zoom level for the layer. You can add multiple layers on one background map. That will give you drilling capability on BI Map thematic view.
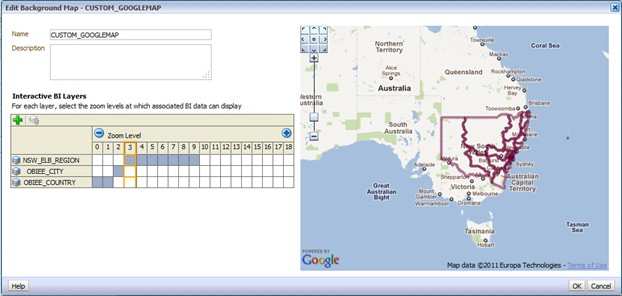

7, click OK to saving all the map data setting.


6, Create your BI Map report with the imported boundary on map

1, Define Answers Report Criteria;
In minimal, you need to include at least one fact measure and one dimensional column in your report criteria. The dimensional column must be the one BI Key column that you defined at step 5.5.
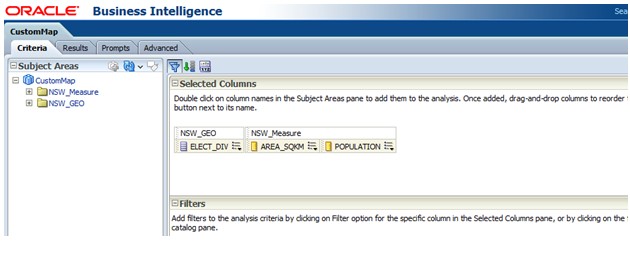

2, Add a map view for the answers report. If all the settings in the previous steps are correct, you should be able to get the initial result as below automatically

3, Click on the pencil icon on top right to edit the map view;

If you get the error message like below, check two settings in your BI Admin Console:
  • Star schema join in business model; 
  • Aggregation rule for the measure column;


If no error message, you can add/modify map format as you want
Now, enjoy the visualization of your business intelligence on interactive local map. 
Until next time.

Monday, 21 November 2011

Put Intelligence on the map (part 1)

Business has been collecting and analyzing geospatial information for a long time. Being able to view information such as, volume of revenue from different regions or number of events happened in different suburbs, on a zoomable map is of great value to people who manage the business. Since the 11g release, users of OBIEE are enabled to visualize BI on digital maps. From world level to street level, users can easily overlay business information on maps. The correlation between location and business can be seen intuitively. In this blog post, I will walk you through the things behind the scene of OBIEE Map View. 

There are four major players in OBIEE Mapview – Spatial data, Map tiles, Oracle Mapviewer and OBIEE.
 
Oracle database (with Locator or Spatial option) stores all the spatial data such as coordinates of locations and boundary of regions. Database is also in charge of processing all the spatial based queries. For instance, what are the longitude and latitude of the centre of Sydney city? If I draw a cycle with 10KMs radius around that city centre, which suburbs are covered in the cycle? In simple words, Oracle database is the brain – it stores data and process request.

Map tiles assemble and display pregenerated map image tiles. The map tile layer displays static map content that does not change very often, and it is typically used as the background map by the client application.  A map image tile will be fetched from the map services provider which stores and manages map images together related information such as zoom level, size, and location of the tile.  Oracle MapViewer has an internal map services provider but it can also be configured to integrate with external providers like Google Map, Bing Map. In simple words, Map tiles are in charge of visualization – map images.

Oracle Mapviewer is part of Oracle Fusion Middleware. Its main deliverable is a J2EE application that can be deployed to a J2EE container. MapViewer includes the following main components:
  • A core rendering engine (Java library) that performs cartographic rendering.
  • A suite of application programming interfaces (APIs) that allow programmable access to MapViewer features.
  • A graphical Map builder tool that enables you to create map symbols, define spatial data rendering rules, and create and edit MapViewer objects.
  • Oracle Map, which includes map cache and FOI (feature of interest) servers that facilitate the development of interactive geospatial Web applications.
The core rendering engine connects to the Oracle database through Java Database Connectivity (JDBC). It also reads the map metadata (such as map definitions, styling rules, and symbologies created through the Map Builder tool) from the database, and applies the metadata to the retrieved spatial data during rendering operations. In simple words, MapViewer is the bridge, it assembles coordinates and map images together, render symbols, lines, colors on map.

OBIEE is Oracle’s BI solution which has pre-built integration with Oracle MapViewer. Once the proper configurations are done by administrator, from OBIEE end user’s point view, technical complexities such as spatial data, map tiles, map viewer are all hidden in a black box. Business Intelligence on interactive digital Map is just another type of BI view. As long as the criteria of a Analysis includes geographical information (e.g. name of city, code of mine, etc) and numeric measures, the business users can have a map view of the report by simply choosing the format (e.g. color fill, shape, etc) of measure that they want to put on top of map. The rest will be handled by the “black box”.

The following diagram gives a simple summary of how Business Intelligence works together on digital map with OBIEE and other Oracle technologies.
How OBIEE Map View works

For the next post, the key words are "Hands-on", "Customized Geospatial data", "Oracle Map Builder", "Google Map". Please stay tuned.

Sunday, 6 November 2011

What is Business Intelligence?


Back in 2008, one of my friends had the following conversation with me in a BBQ party:
"So you work in an IT company, what specific area?" He asked.
"BI - Business Intelligence" I said.
"That sounds pretty cool. Do you spend a lot of time with things like Robots?" He asked again.
...

According to Merriam-Webster Dictionary, the definition of "Intelligence" is
A) The ability to learn or understand or to deal with new or trying situations: REASON: also: the skilled use of reason
           Or
B) News or information concerning an enemy or possible enemy or an area; also : an agency engaged in obtaining such information.

In BI, the letter "I" means "Intelligence" as of "Central Intelligence Agency", but not "Intelligence" as of "Artificial Intelligence". Therefore, the definition of Business Intelligence can be simply put as "getting information of Business for having a better business". Logically, a few questions will rise: What information do I need to collect? How should I manage the information? In which ways I can digest the information?

Let's start with the first question: what information do I need to collect? My answer would be: Any information as long as it can help your business. It can be the operational information that you collect at the point of sale. It can be the historical information that you have been accumulating for decades. It can even be the "big data" that is being generated every second by millions of social network users. In order to make quicker and better decisions, people want to have answers to all kinds of questions related with their business. What other things my customers normally buy when they refill their car at our fuel stations? What is the trend of my in-store sale VS online sale in the last 10 years? What are people talking about online after the launch of my new product? Nowadays, business information has already been widely recognized as an important enterprise asset. As the person who runs the business, you should carefully collect relevant information and maximize the return on this invaluable asset.
https://blogger.googleusercontent.com/img/b/R29vZ2xl/AVvXsEhTF0KNwJjVAUVMb6d2iXz1NisFB9wbYsDu6P19sHiVMQwpWNJRB6JdDKJuV-vd025DInSm6d1KSaN_J9l8RuShfhFZnqdmF0KDqSbZ-Z55kJHpXduyDPyPsVfAhKU4uQvmwr5EIlZKGcub/s1600/ScreenHunter_01+Nov.+13+23.37.jpg
Information Asset


Here comes the second set of questions: How do I collect the information? How do I manage the information so that it can give business insight to the end users? The answer in my mind is ETL (data Extraction, Transformation and Loading) and DW (Data Warehouse). It's not unusual that one business has data scattered in multiple heterogeneous data storage. With a proper ETL tool, data from different sources can be extracted, transformed accordingly and loaded into the repository for analysis purpose. A mature ERP or CRM system is normally the major source for ETL process as it records the most detail operational business activities such as transaction closed, customer acquired, product manufactured, etc. In addition, other complementary information such as Excel files exchanged between people, small Access databases created and managed by line of business, old but relevant data stored in legacy systems, may also need to be processed via ETL, so that a comprehensive intelligence storage can be build to cater for all kinds of business questions. The destination of ETL process is normally a data warehouse (or several data marts which is data warehouse with smaller controlled scope). Data Warehouse is the foundation of Business Intelligence. Unlike OLTP system which needs to insert/update/delete data in timely fashion, Data Warehouse needs to be optimized for performing data queries. Consequently, data in Data Warehouse is saved in denormalized form of database schemas. Typical database denormalization techniques include but not limited to: materialized views, star schemas or OLAP cubes. Each approach has its pros and cons but they all share the same objectives: speed up the query of business measures (e.g. sales revenue, call duration) by different business dimensions (e.g. time, location, line of business).
https://blogger.googleusercontent.com/img/b/R29vZ2xl/AVvXsEij5Kut9x98_QSkhip4bg_SrRXYOvo11NrD06s1BvKVLvHbIn47TWoDo90TW_GXgqRa2vCk2Q1QaazX0OoyzDS4vTrlwmQNVTUC6wib-B2Y_x9c4YfJ_I-1D2NB1Y4Tqr3Thev8FcpQOEv6/s320/ScreenHunter_02+Nov.+13+23.53.jpg
ETL and DW

So far, we've discussed two aspects: where is the information coming from, how to collect and stored it so that it can be ready for business questions. Now, let's have a look at the last one: With a Business Intelligence system, how can the business operators find and digest information effectively and efficiently? As far as I understand, a competent BI system should be able to expose information through three basic channels: periodic operational report, interactive dashboard, and ad-hoc analysis. Operational reporting is the entry level part of Business Intelligence. It periodically provides the updated snapshots of business from different aspects. Operational reporting normally consists of a set of pre-defined (both data query and layout) reports such as weekly inventory report, monthly salary expenditure report and so on. It helps people to record and monitor what happened with the business. Interactive dashboard is the way how variant reports can be organized together on one screen display. Without scrolling or switching the display, user should be able to see multiple related  reports at a glance. For example, a typical Financial Profitability analysis dashboard may have reports such as P&L Summary, Cost Breakdown, Product Gross Margin and Customer Gross Margin on one single page. In addition, Interactions such as filtering, drilling, layout personalization should also be available for users. With Interactive dashboard, people can focus on interested information in different forms, slice and dice, drill and filter to get a deeper business insight. Ad-hoc analysis means analyze data in a exploratory self-service approach. Business users should be able to find answers to their questions by defining criteria, customizing calculation formula, specifying conditional formatting and so on in a friendly graphical interface. When it's necessary, a BI environment should also allow users to quickly create tabulate or graphical reports from arbitrary data sources without going through a formal data modeling process. Ad-hoc analysis empowers business users to find answers to the specific questions which are not covered by canned dashboards and reports. Besides these three major intelligence delivery channels, a mature BI system will also provide Proactive alerting, Office integration, Mobile capability, etc.
https://blogger.googleusercontent.com/img/b/R29vZ2xl/AVvXsEjHQr7F6oiHEBXErLdtwfN6Y8Yu6aR8hBT_3nd6rWquBBVXhjmDweNl16_GhmpOtBNzZ2i1AXLKfGfPbx2vN-s0qBSMDHl5CEPKDJ_Nd_o2hsF1P3H8iz6RicPI15dOKhe4nGyBrdNhrg3Y/s640/ScreenHunter_02+Nov.+21+23.03.jpg
Delivery Channels


In summary, Business Intelligence is a platform that helps people to collect, manage and convey information. By turning big volume of multifarious data into sensible abstract intelligence, BI helps people make business decisions in a more efficient and accurate way.

In my future blog entries, I will share with you what I've learnt about general Business Intelligence and Oracle Business Intelligence solution.