Showing posts with label Oracle MapView. Show all posts

Sunday, 15 January 2012

Miss is as good as a mile

A few days ago, I was reviewing my prior post and something unusual caught my attention.

How come those densely populated suburbs in Sydney are not covered by the thematic view for postal areas??? In order to further confirm the issue, I moved the map around to another state and I found some thematic views are put on Tasman sea (see below)!!! I've got an alignment issue.
This is a critical issue for a BI Mapview as Business Intelligence are not accurately aligned with the real location on map. A few centimeters shifting of map theme (geometries that represents regions) on Google Map will make users look at the business information that is actually relevant with area/spot a few kilometers away. This makes the whole spatial analysis meaningless.

After spending some time searching and studying, I found the root cause of this problem - the inconsistency between SRIDs for Google Map and spatial data in database. SRID represents "Spatial Reference system IDentifier" which is a unique value used to unambiguously identify projected, unprojected, and local spatial coordinate system definitions. These coordinate systems form the heart of all GIS applications. Older map uses old reference system while newer maps use more accurate reference system made using satellites and sophisticated electronic equipment. The coordinates for a point on the earth can vary significantly depending on the SRID used. Consequently, if all spatial data is not in the same spatial reference system, the geographic layers will not overlay and the analysis will become misleading.

In our case, the map service provider Google is using SRID 3785.
 However,when import spatial data from shapefiles into Oracle database, the SRID is set to 8307 by default. It can be retrieved by running the SQL Script below:

select table_name, column_name, srid from user_sdo_geom_metadata
where table_name = 'NSW_ELB_REGION';

Because it's not practical for us to change the SRID of Google Map, we need to do something on our spatial data in Oracle database so that it is compatible with SRID 3785.

In Oracle Spatial Developer's guide, three approaches are suggested for fixing this issue:
1, Use SRID 4055 data;
2,   Declare an EPSG rule between SRID 8307 and 3785;
3,   Call oracle stored procedures to convert spatial data that physically stored in database;

I've tested the first two approaches in my environment. Either of them fixed the alignment issue perfectly for me.

For the first approach, all you have to do is specify the SRID value as 4055 while import the shapefile data with Oracle Mapbuilder (step in my last post). Then the data will be loaded into Oracle database as SRID 4055 which is compatible with Google's SRID 3785.

However, if reloading the data is not a feasible option for you, you can run the following SQL script to declare a transformation rule between SRID 8307 and 3785. As the result, when Oracle retrieve the spatial data that you loaded, it will apply the rule to transfer it to SRID 3785 and send it to Oracle Mapviewer for rendering.
CALL sdo_cs.create_pref_concatenated_op(830723785,
'CONCATENATED OPERATION',
TFM_PLAN(SDO_TFM_CHAIN(8307, 1000000000, 4055, 19847, 3785)),
NULL);

Now, the SRIDs between the spatial data and Google Map are consistent and I can have my Business Intelligence perfectly overlay with Google Map. No more CBD region displayed as middle of no where or resident postal area sitting on the surface of sea.


Saturday, 17 December 2011

Put Intelligence on the map (part 2)

In my last post, we discussed how OBIEE enables geospatial analysis on digital map. Now it’s time to get hands dirty and learn more from practice.

Out of the box, the deployment of OBIEE includes Oracle Mapviewer. However, no geospatial data or map tiles are provided with the product installation. Those can be acquired separately from NAVTEQ. A package of free sample NAVTEQ data with relevant deployment instructions can be downloaded from the URL: http://www.oracle.com/technetwork/middleware/bi-foundation/obiee-samples-167534.html

The free sample NAVTEQ data contains two components: geospatial data (coordinates, boundaries, etc) and map tiles (background images for different zoom level) which are good enough for you to have a preliminary taste of OBIEE geospatial analysis. But, if you want to analyze your business intelligence on street- level detail map or with specific postcode/suburb boundary in your country, you need to find more comprehensive source for map tiles and geospatial data. For something that you want to put on production, paid data package with professional support services should always be the first choice. For learning, practicing or demoing purpose, there is free self-service approach to achieve your goal. In this blog post, you will see how to leverage government’s statistic websites and Google map to have you business intelligence on local map with local boundaries. Instead of having lame geospatial analysis like this:


You will be able to achieve a much better one like this:


Step 1, Download Boundary Geospatial data

In order to draw boundary on the map, we need geospatial data stored in oracle database (with Spatial or Locator option, of course). The Sample NAVTEQ data doesn’t contain detail boundary information for countries other than United States. We need to find it from somewhere else.

 As I live in Australia, I will use Australia New South Wales Electoral boundary data as example here. The two government websites below provide very rich geospatial data for different categories. Make sure the data you choose is ESRI ShapeFile format and has “boundary” information, as we want to generate thematic view on our BI Map report. You should be able to find similar free information from your local government websites.
http://data.gov.au/tag/geospatial-information/
http://www.aec.gov.au/Electorates/gis/gis_datadownload.htm

After the extraction of download zip file, you should have a set of files look similar to:
ESRI Shape Files

 Step 2, Import ShapeFile data into your Oracle database 

1, Make sure the availability of the following files in the file system of your Oracle database server:
$ORACLE_HOME/jdbc/lib/ojdbc5.jar
$ORACLE_HOME/md/jlib/sdoutl.jar
$ORACLE_HOME/md/jlib/sdoapi.jar

If you are missing Sdoutl.jar and sdoapi.jar, they can be downloaded from http://www.oracle.com/technetwork/database/options/spatial/downloads/software/sp-download-distlic-522138.html

2, Copy the Shapefiles to the file system of your database server;


3, Run Oracle MapBuilder to import ShapeFile into Oracle database;

Connect to your database at first


Choose the shapefile that you downloaded;

Keep the default value and click on “next”;


Choose NOT to create theme now and go next

Then you should be able to find a new table created in your database:


Step 3, Create Geometry Theme in Oracle database for the boundary data imported


1, right click on “Geometry Themes” and create a new theme;


3, in the wizard, make sure you choose the imported geospatial table for “Base Table”;


4, Tick the box label style and choose a column as attribute for this style. Later on you will use this column to link with the geo information column (e.g. city name, district name, etc) in your BI subject area. Specify the value for “Label Style” and change the value for “Label Function” from -1 to 1. In this example, I used the column “Electoral Division name”;


5, specify the query condition if you have any


6,  Click on Finish to create the theme;


Step 4, Setup Google Map in Oracle MapViewer
Because the NavTeq sample data doesn’t provide map background details beyond country level for Countries other than United States, we want to leverage Google Map as a service for the background images. The instructions for configuring Google Map with Oracle Mapviewer can be found from the section 2.7.2 of deployment guide for OBIEE Sample App.

5, Setup layers and background map in OBIEE 1, click on manage map data in OBIEE administration page


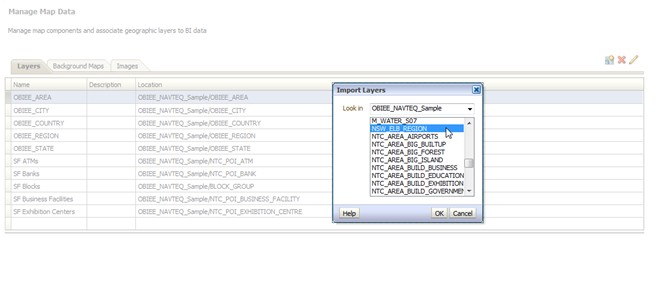
2, Import a new layer. Choose to import layers from the Geometry Theme that you just created in step 3.3;


3, Click on the pencil icon to edit the newly created layer. Map the Layer Key with a BI Key from your BI subject area. Normally the BI Key will be a dimensional table column for end user facing geospatial information such as country name, city name, district name, etc. Click on OK to save the changes;


4, Go to “Background Maps” tab and click on “import background maps”. Chose the Google Map entry that you configured in step 4;


5, Add an interactive BI Layer to the background map. Choose the one that you just imported at step 5.3


6, setup a proper zoom level for the layer. You can add multiple layers on one background map. That will give you drilling capability on BI Map thematic view.


7, click OK to saving all the map data setting.


6, Create your BI Map report with the imported boundary on map

1, Define Answers Report Criteria;
In minimal, you need to include at least one fact measure and one dimensional column in your report criteria. The dimensional column must be the one BI Key column that you defined at step 5.5.


2, Add a map view for the answers report. If all the settings in the previous steps are correct, you should be able to get the initial result as below automatically

3, Click on the pencil icon on top right to edit the map view;

If you get the error message like below, check two settings in your BI Admin Console:
  • Star schema join in business model; 
  • Aggregation rule for the measure column;


If no error message, you can add/modify map format as you want
Now, enjoy the visualization of your business intelligence on interactive local map. 
Until next time.

Monday, 21 November 2011

Put Intelligence on the map (part 1)

Business has been collecting and analyzing geospatial information for a long time. Being able to view information such as, volume of revenue from different regions or number of events happened in different suburbs, on a zoomable map is of great value to people who manage the business. Since the 11g release, users of OBIEE are enabled to visualize BI on digital maps. From world level to street level, users can easily overlay business information on maps. The correlation between location and business can be seen intuitively. In this blog post, I will walk you through the things behind the scene of OBIEE Map View. 

There are four major players in OBIEE Mapview – Spatial data, Map tiles, Oracle Mapviewer and OBIEE.
 
Oracle database (with Locator or Spatial option) stores all the spatial data such as coordinates of locations and boundary of regions. Database is also in charge of processing all the spatial based queries. For instance, what are the longitude and latitude of the centre of Sydney city? If I draw a cycle with 10KMs radius around that city centre, which suburbs are covered in the cycle? In simple words, Oracle database is the brain – it stores data and process request.

Map tiles assemble and display pregenerated map image tiles. The map tile layer displays static map content that does not change very often, and it is typically used as the background map by the client application.  A map image tile will be fetched from the map services provider which stores and manages map images together related information such as zoom level, size, and location of the tile.  Oracle MapViewer has an internal map services provider but it can also be configured to integrate with external providers like Google Map, Bing Map. In simple words, Map tiles are in charge of visualization – map images.

Oracle Mapviewer is part of Oracle Fusion Middleware. Its main deliverable is a J2EE application that can be deployed to a J2EE container. MapViewer includes the following main components:
  • A core rendering engine (Java library) that performs cartographic rendering.
  • A suite of application programming interfaces (APIs) that allow programmable access to MapViewer features.
  • A graphical Map builder tool that enables you to create map symbols, define spatial data rendering rules, and create and edit MapViewer objects.
  • Oracle Map, which includes map cache and FOI (feature of interest) servers that facilitate the development of interactive geospatial Web applications.
The core rendering engine connects to the Oracle database through Java Database Connectivity (JDBC). It also reads the map metadata (such as map definitions, styling rules, and symbologies created through the Map Builder tool) from the database, and applies the metadata to the retrieved spatial data during rendering operations. In simple words, MapViewer is the bridge, it assembles coordinates and map images together, render symbols, lines, colors on map.

OBIEE is Oracle’s BI solution which has pre-built integration with Oracle MapViewer. Once the proper configurations are done by administrator, from OBIEE end user’s point view, technical complexities such as spatial data, map tiles, map viewer are all hidden in a black box. Business Intelligence on interactive digital Map is just another type of BI view. As long as the criteria of a Analysis includes geographical information (e.g. name of city, code of mine, etc) and numeric measures, the business users can have a map view of the report by simply choosing the format (e.g. color fill, shape, etc) of measure that they want to put on top of map. The rest will be handled by the “black box”.

The following diagram gives a simple summary of how Business Intelligence works together on digital map with OBIEE and other Oracle technologies.
How OBIEE Map View works

For the next post, the key words are "Hands-on", "Customized Geospatial data", "Oracle Map Builder", "Google Map". Please stay tuned.