Out of the box, the deployment of OBIEE includes Oracle Mapviewer. However, no geospatial data or map tiles are provided with the product installation. Those can be acquired separately from NAVTEQ. A package of free sample NAVTEQ data with relevant deployment instructions can be downloaded from the URL: http://www.oracle.com/technetwork/middleware/bi-foundation/obiee-samples-167534.html
The free sample NAVTEQ data contains two components: geospatial data (coordinates, boundaries, etc) and map tiles (background images for different zoom level) which are good enough for you to have a preliminary taste of OBIEE geospatial analysis. But, if you want to analyze your business intelligence on street- level detail map or with specific postcode/suburb boundary in your country, you need to find more comprehensive source for map tiles and geospatial data. For something that you want to put on production, paid data package with professional support services should always be the first choice. For learning, practicing or demoing purpose, there is free self-service approach to achieve your goal. In this blog post, you will see how to leverage government’s statistic websites and Google map to have you business intelligence on local map with local boundaries. Instead of having lame geospatial analysis like this:
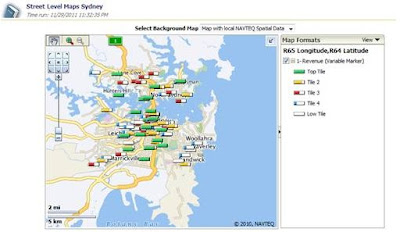
You will be able to achieve a much better one like this:

Step 1, Download Boundary Geospatial data
In order to draw boundary on the map, we need geospatial data stored in oracle database (with Spatial or Locator option, of course). The Sample NAVTEQ data doesn’t contain detail boundary information for countries other than United States. We need to find it from somewhere else.
As I live in Australia, I will use Australia New South Wales Electoral boundary data as example here. The two government websites below provide very rich geospatial data for different categories. Make sure the data you choose is ESRI ShapeFile format and has “boundary” information, as we want to generate thematic view on our BI Map report. You should be able to find similar free information from your local government websites.
http://data.gov.au/tag/geospatial-information/
http://www.aec.gov.au/Electorates/gis/gis_datadownload.htm
After the extraction of download zip file, you should have a set of files look similar to:
Step 2, Import ShapeFile data into your Oracle database
1, Make sure the availability of the following files in the file system of your Oracle database server:
$ORACLE_HOME/jdbc/lib/ojdbc5.jar
$ORACLE_HOME/md/jlib/sdoutl.jar
$ORACLE_HOME/md/jlib/sdoapi.jar
If you are missing Sdoutl.jar and sdoapi.jar, they can be downloaded from http://www.oracle.com/technetwork/database/options/spatial/downloads/software/sp-download-distlic-522138.html
2, Copy the Shapefiles to the file system of your database server;
The free sample NAVTEQ data contains two components: geospatial data (coordinates, boundaries, etc) and map tiles (background images for different zoom level) which are good enough for you to have a preliminary taste of OBIEE geospatial analysis. But, if you want to analyze your business intelligence on street- level detail map or with specific postcode/suburb boundary in your country, you need to find more comprehensive source for map tiles and geospatial data. For something that you want to put on production, paid data package with professional support services should always be the first choice. For learning, practicing or demoing purpose, there is free self-service approach to achieve your goal. In this blog post, you will see how to leverage government’s statistic websites and Google map to have you business intelligence on local map with local boundaries. Instead of having lame geospatial analysis like this:

You will be able to achieve a much better one like this:

Step 1, Download Boundary Geospatial data
In order to draw boundary on the map, we need geospatial data stored in oracle database (with Spatial or Locator option, of course). The Sample NAVTEQ data doesn’t contain detail boundary information for countries other than United States. We need to find it from somewhere else.
As I live in Australia, I will use Australia New South Wales Electoral boundary data as example here. The two government websites below provide very rich geospatial data for different categories. Make sure the data you choose is ESRI ShapeFile format and has “boundary” information, as we want to generate thematic view on our BI Map report. You should be able to find similar free information from your local government websites.
http://data.gov.au/tag/geospatial-information/
http://www.aec.gov.au/Electorates/gis/gis_datadownload.htm
After the extraction of download zip file, you should have a set of files look similar to:
 |
| ESRI Shape Files |
Step 2, Import ShapeFile data into your Oracle database
1, Make sure the availability of the following files in the file system of your Oracle database server:
$ORACLE_HOME/jdbc/lib/ojdbc5.jar
$ORACLE_HOME/md/jlib/sdoutl.jar
$ORACLE_HOME/md/jlib/sdoapi.jar
If you are missing Sdoutl.jar and sdoapi.jar, they can be downloaded from http://www.oracle.com/technetwork/database/options/spatial/downloads/software/sp-download-distlic-522138.html
2, Copy the Shapefiles to the file system of your database server;
3, Run Oracle MapBuilder
to import ShapeFile into Oracle database;
Oracle MapBuilder can be downloaded from: http://www.oracle.com/technetwork/middleware/mapviewer/downloads/index.html
Connect to your database at first
Choose the shapefile
that you downloaded;
Keep the default value
and click on “next”;
Choose NOT to create theme
now and go next
Then you should be able to find a new table created in your
database:
Step 3, Create Geometry Theme in Oracle database for the boundary data imported
1, right click on “Geometry Themes” and create a new theme;
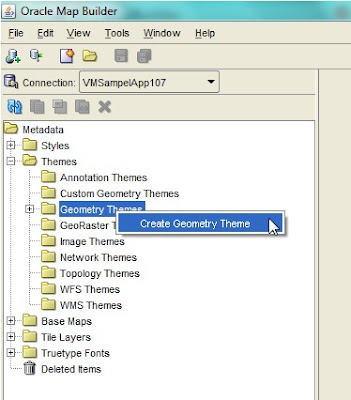
3, in the wizard, make sure you choose the imported geospatial table for “Base Table”;
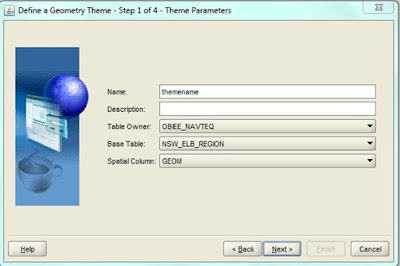
4, Tick the box label style and choose a column as attribute
for this style. Later on you will use this column to link with the geo
information column (e.g. city name, district name, etc) in your BI subject
area. Specify the value for “Label Style” and change the value for “Label
Function” from -1 to 1. In this example, I used the column “Electoral Division
name”;
5, specify the query condition if you have any
6, Click on Finish to
create the theme;
Step 4, Setup Google Map in Oracle MapViewer
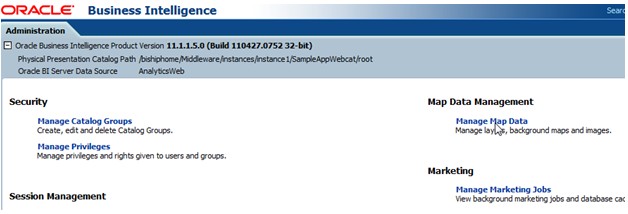
2, Import a new layer. Choose to import layers from the Geometry Theme that you just created in step 3.3;

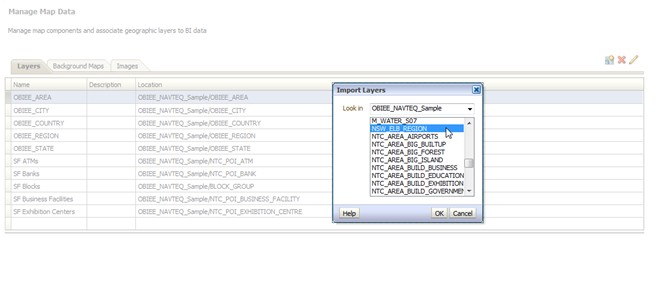


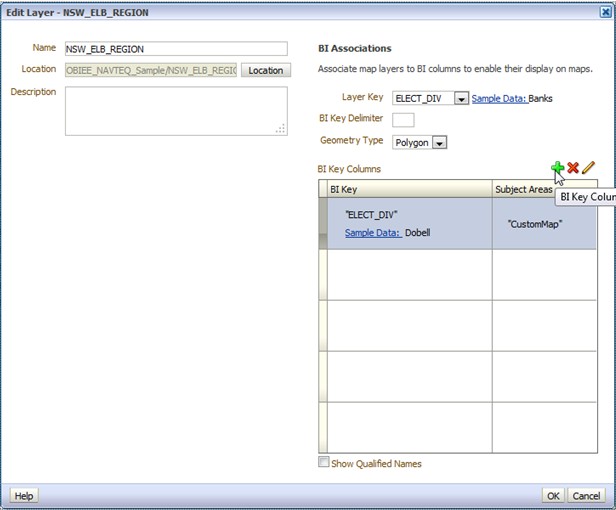
3, Click on the pencil icon to edit the newly created layer. Map the Layer Key with a BI Key from your BI subject area. Normally the BI Key will be a dimensional table column for end user facing geospatial information such as country name, city name, district name, etc. Click on OK to save the changes;
4, Go to “Background Maps” tab and click on “import background maps”. Chose the Google Map entry that you configured in step 4;


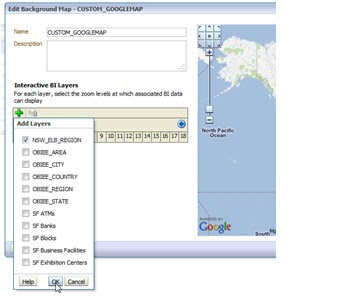
5, Add an interactive BI Layer to the background map. Choose the one that you just imported at step 5.3
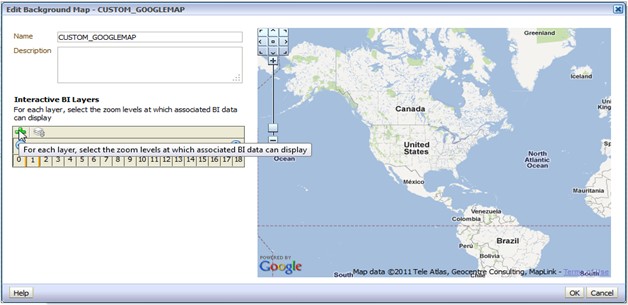

4, Go to “Background Maps” tab and click on “import background maps”. Chose the Google Map entry that you configured in step 4;


5, Add an interactive BI Layer to the background map. Choose the one that you just imported at step 5.3


6, setup a proper zoom level for the layer. You can add multiple layers on one background map. That will give you drilling capability on BI Map thematic view.
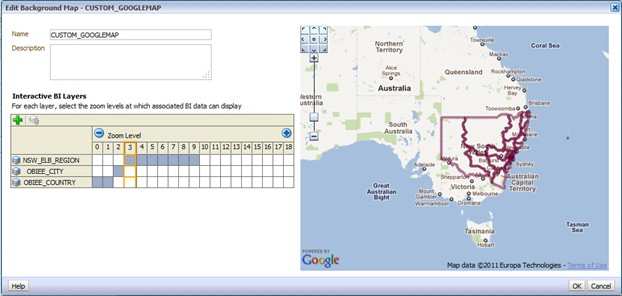
7, click OK to saving all the map data setting.

7, click OK to saving all the map data setting.
6, Create your BI Map report with the imported boundary on map
1, Define Answers Report Criteria;
In minimal, you need to include at least one fact measure and one dimensional column in your report criteria. The dimensional column must be the one BI Key column that you defined at step 5.5.
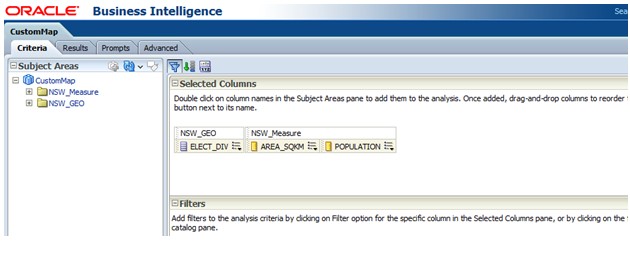
2, Add a map view for the answers report. If all the settings in the previous steps are correct, you should be able to get the initial result as below automatically
3, Click on the pencil icon on top right to edit the map view;
If you get the error message like below, check two settings in your BI Admin Console:
If you get the error message like below, check two settings in your BI Admin Console:
- Star schema join in business model;
- Aggregation rule for the measure column;
Now, enjoy the visualization of your business intelligence on interactive local map.
Until next time.


